coredump
当程序触发异常,且异常无法被内核处理时,程序在内核中会触发crash流程,并生成coredump文件,保存程序异常时的上下文信息。它就像是程序世界的"黑匣子",记录了崩溃瞬间的完整现场。
生成coredump文件
举个🌰, 该程序对NULL指针进行函数调用, 会造成段错误Segmentation fault
但是默认情况下程序崩溃之后不会产生coredump文件
这是因为shell程序资源被限制, 默认不产生core文件.
使用ulimit -a可以查看所有资源的限额, 可以看到其中core file size被限制为0
┌──(root㉿DustReich)-[/home/dustball/main]
└─# ulimit -a
real-time non-blocking time (microseconds, -R) unlimited
core file size (blocks, -c) 0
data seg size (kbytes, -d) unlimited
scheduling priority (-e) 0
file size (blocks, -f) unlimited
pending signals (-i) 31725
max locked memory (kbytes, -l) 65536
max memory size (kbytes, -m) unlimited
open files (-n) 10240
pipe size (512 bytes, -p) 8
POSIX message queues (bytes, -q) 819200
real-time priority (-r) 0
stack size (kbytes, -s) 8192
cpu time (seconds, -t) unlimited
max user processes (-u) 31725
virtual memory (kbytes, -v) unlimited
file locks (-x) unlimited
将core file size设置为unlimited
┌──(root㉿DustReich)-[/home/dustball/main]
└─# ulimit -c unlimited
┌──(root㉿DustReich)-[/home/dustball/main]
└─# ulimit -c
unlimited
此时程序崩溃就会产生coredump文件了
默认情况下,coredump文件会在当前目录下以core.PID的形式产生.
可以在 /proc/sys/kernel/core_pattern文件中修改默认的coredump命名规则
┌──(root㉿DustReich)-[/home/dustball/main]
└─# echo "./core-%p-%u-%g-%s-%h-%e" > /proc/sys/kernel/core_pattern
%% 单个%字符
%p 所dump进程的进程ID
%u 所dump进程的实际用户ID
%g 所dump进程的实际组ID
%s 导致本次core dump的信号
%t core dump的时间 (由1970年1月1日计起的秒数)
%h 主机名
%e 程序文件名
┌──(root㉿DustReich)-[/home/dustball/main]
└─# ./main
Segmentation fault (core dumped)
┌──(root㉿DustReich)-[/home/dustball/main]
└─# ls
core-418-0-0-11-DustReich-main main main.c
进程号418
root用户执行因此用户id和组id都是0
信号值11对应SIGSEGV段错误
DustReich主机名
main程序名
coredump文件结构
┌──(root㉿DustReich)-[/home/dustball/main]
└─# file core-418-0-0-11-DustReich-main
core-418-0-0-11-DustReich-main: ELF 64-bit LSB core file, x86-64, version 1 (SYSV), SVR4-style, from './main', real uid: 0, effective uid: 0, real gid: 0, effective gid: 0, execfn: './main', platform: 'x86_64'
使用file命令观察coredump文件, 它也是ELF格式
coredump文件中都有什么呢?
coredump文件的elf类型为core
coredump没有节区, 但是有段. 这是因为coredump只关注程序的运行时信息
┌──(root㉿DustReich)-[/home/dustball/main]
└─# readelf -a core-418-0-0-11-DustReich-main
ELF Header:
  Magic:   7f 45 4c 46 02 01 01 00 00 00 00 00 00 00 00 00
  Class:                             ELF64
  Data:                              2's complement, little endian
  Version:                           1 (current)
  OS/ABI:                            UNIX - System V
  ABI Version:                       0
  Type:                              CORE (Core file)
  Machine:                           Advanced Micro Devices X86-64
  Version:                           0x1
  Entry point address:               0x0
  Start of program headers:          64 (bytes into file)
  Start of section headers:          0 (bytes into file)
  Flags:                             0x0
  Size of this header:               64 (bytes)
  Size of program headers:           56 (bytes)
  Number of program headers:         23
  Size of section headers:           0 (bytes)
  Number of section headers:         0
  Section header string table index: 0

There are no sections in this file.

There are no section groups in this file.

Program Headers:
  Type           Offset             VirtAddr           PhysAddr
                 FileSiz            MemSiz              Flags  Align
  NOTE           0x0000000000000548 0x0000000000000000 0x0000000000000000
                 0x0000000000000d28 0x0000000000000000         0x4
  LOAD           0x0000000000002000 0x0000000000400000 0x0000000000000000
                 0x0000000000001000 0x0000000000001000  R      0x1000
  LOAD           0x0000000000003000 0x0000000000401000 0x0000000000000000
                 0x0000000000000000 0x0000000000001000  R E    0x1000
  LOAD           0x0000000000003000 0x0000000000402000 0x0000000000000000
                 0x0000000000000000 0x0000000000001000  R      0x1000
  LOAD           0x0000000000003000 0x0000000000403000 0x0000000000000000
                 0x0000000000001000 0x0000000000001000  R      0x1000
  LOAD           0x0000000000004000 0x0000000000404000 0x0000000000000000
                 0x0000000000001000 0x0000000000001000  RW     0x1000
  LOAD           0x0000000000005000 0x00007d795f969000 0x0000000000000000
                 0x0000000000003000 0x0000000000003000  RW     0x1000
  LOAD           0x0000000000008000 0x00007d795f96c000 0x0000000000000000
                 0x0000000000001000 0x0000000000028000  R      0x1000
  LOAD           0x0000000000009000 0x00007d795f994000 0x0000000000000000
                 0x0000000000000000 0x0000000000165000  R E    0x1000
  LOAD           0x0000000000009000 0x00007d795faf9000 0x0000000000000000
                 0x0000000000000000 0x0000000000056000  R      0x1000
  LOAD           0x0000000000009000 0x00007d795fb4f000 0x0000000000000000
                 0x0000000000004000 0x0000000000004000  R      0x1000
  LOAD           0x000000000000d000 0x00007d795fb53000 0x0000000000000000
                 0x0000000000002000 0x0000000000002000  RW     0x1000
  LOAD           0x000000000000f000 0x00007d795fb55000 0x0000000000000000
                 0x000000000000d000 0x000000000000d000  RW     0x1000
  LOAD           0x000000000001c000 0x00007d795fb6f000 0x0000000000000000
                 0x0000000000002000 0x0000000000002000  RW     0x1000
  LOAD           0x000000000001e000 0x00007d795fb71000 0x0000000000000000
                 0x0000000000001000 0x0000000000001000  R      0x1000
  LOAD           0x000000000001f000 0x00007d795fb72000 0x0000000000000000
                 0x0000000000000000 0x0000000000028000  R E    0x1000
  LOAD           0x000000000001f000 0x00007d795fb9a000 0x0000000000000000
                 0x0000000000000000 0x000000000000b000  R      0x1000
  LOAD           0x000000000001f000 0x00007d795fba5000 0x0000000000000000
                 0x0000000000002000 0x0000000000002000  R      0x1000
  LOAD           0x0000000000021000 0x00007d795fba7000 0x0000000000000000
                 0x0000000000001000 0x0000000000001000  RW     0x1000
  LOAD           0x0000000000022000 0x00007d795fba8000 0x0000000000000000
                 0x0000000000001000 0x0000000000001000  RW     0x1000
  LOAD           0x0000000000023000 0x00007ffd29549000 0x0000000000000000
                 0x0000000000021000 0x0000000000021000  RW     0x1000
  LOAD           0x0000000000044000 0x00007ffd295e7000 0x0000000000000000
                 0x0000000000004000 0x0000000000004000  R      0x1000
  LOAD           0x0000000000048000 0x00007ffd295eb000 0x0000000000000000
                 0x0000000000002000 0x0000000000002000  R E    0x1000

There is no dynamic section in this file.

There are no relocations in this file.
No processor specific unwind information to decode

Dynamic symbol information is not available for displaying symbols.

No version information found in this file.

Displaying notes found at file offset 0x00000548 with length 0x00000d28:
  Owner                Data size        Description
  CORE                 0x00000150       NT_PRSTATUS (prstatus structure)
  CORE                 0x00000088       NT_PRPSINFO (prpsinfo structure)
  CORE                 0x00000080       NT_SIGINFO (siginfo_t data)
  CORE                 0x00000170       NT_AUXV (auxiliary vector)
  CORE                 0x00000394       NT_FILE (mapped files)
    Page size: 4096
                 Start                 End         Page Offset
    0x0000000000400000  0x0000000000401000  0x0000000000000000
        /home/dustball/main/main
    0x0000000000401000  0x0000000000402000  0x0000000000000001
        /home/dustball/main/main
    0x0000000000402000  0x0000000000403000  0x0000000000000002
        /home/dustball/main/main
    0x0000000000403000  0x0000000000404000  0x0000000000000002
        /home/dustball/main/main
    0x0000000000404000  0x0000000000405000  0x0000000000000003
        /home/dustball/main/main
    0x00007d795f96c000  0x00007d795f994000  0x0000000000000000
        /usr/lib/x86_64-linux-gnu/libc.so.6
    0x00007d795f994000  0x00007d795faf9000  0x0000000000000028
        /usr/lib/x86_64-linux-gnu/libc.so.6
    0x00007d795faf9000  0x00007d795fb4f000  0x000000000000018d
        /usr/lib/x86_64-linux-gnu/libc.so.6
    0x00007d795fb4f000  0x00007d795fb53000  0x00000000000001e2
        /usr/lib/x86_64-linux-gnu/libc.so.6
    0x00007d795fb53000  0x00007d795fb55000  0x00000000000001e6
        /usr/lib/x86_64-linux-gnu/libc.so.6
    0x00007d795fb71000  0x00007d795fb72000  0x0000000000000000
        /usr/lib/x86_64-linux-gnu/ld-linux-x86-64.so.2
    0x00007d795fb72000  0x00007d795fb9a000  0x0000000000000001
        /usr/lib/x86_64-linux-gnu/ld-linux-x86-64.so.2
    0x00007d795fb9a000  0x00007d795fba5000  0x0000000000000029
        /usr/lib/x86_64-linux-gnu/ld-linux-x86-64.so.2
    0x00007d795fba5000  0x00007d795fba7000  0x0000000000000034
        /usr/lib/x86_64-linux-gnu/ld-linux-x86-64.so.2
    0x00007d795fba7000  0x00007d795fba8000  0x0000000000000036
        /usr/lib/x86_64-linux-gnu/ld-linux-x86-64.so.2
  CORE                 0x00000200       NT_FPREGSET (floating point registers)
  LINUX                0x00000340       NT_X86_XSTATE (x86 XSAVE extended state)
   description data: 7f 03 00 00 00 00 00 00 00 00 00 00 00 00 00 00 00 00 00 00 00 00 00 00 80 1f 00 00 ff ff 00 00 00 00 00 00 00 00 00 00 00 00 00 00 00 00 00 00 00 00 00 00 00 00 00 00 00 00 00 00 00 00 00 00 00 00 00 00 00 00 00 00 00 00 00 00 00 00 00 00 00 00 00 00 00 00 00 00 00 00 00 00 00 00 00 00 00 00 00 00 00 00 00 00 00 00 00 00 00 00 00 00 00 00 00 00 00 00 00 00 00 00 00 00 00 00 00 00 00 00 00 00 00 00 00 00 00 00 00 00 00 00 00 00 00 00 00 00 00 00 00 00 00 00 00 00 00 00 00 00 00 00 00 00 00 00 00 00 00 00 00 00 00 00 00 00 00 ff 00 00 00 00 00 00 00 00 00 00 00 ff 00 00 54 45 00 00 00 00 2b 00 2c 00 2b 00 2b 00 2b 00 54 45 00 00 00 00 00 00 00 00 00 00 00 00 00 00 00 00 00 00 2b 00 2c 00 2b 00 2b 00 2b 00 2d 00 30 08 00 00 00 00 00 00 7f 56 00 00 00 00 00 00 00 00 00 00 00 00 ff 00 00 00 00 00 00 00 00 00 2f 2f 2f 2f 2f 2f 2f 2f 2f 2f 2f 2f 2f 2f 2f 2f 00 00 00 00 00 00 00 00 00 00 00 00 00 00 00 00 00 00 00 00 00 00 00 00 00 00 00 00 00 00 00 00 00 00 00 00 00 00 00 00 00 00 00 00 00 00 00 00 00 00 00 00 00 00 00 00 00 00 00 00 00 00 00 00 00 00 00 00 00 00 00 00 00 00 00 00 00 00 00 00 00 00 00 00 00 00 00 00 00 00 00 00 00 00 00 00 00 00 00 00 00 00 00 00 00 00 00 00 00 00 00 00 00 00 00 00 00 00 00 00 00 00 00 00 00 00 00 00 00 00 00 00 00 00 00 00 00 00 00 00 00 00 00 00 00 00 00 00 00 00 00 00 00 00 00 00 00 00 00 00 00 00 00 00 00 00 00 00 00 00 00 00 00 00 00 00 07 00 00 00 00 00 00 00 00 00 00 00 00 00 00 00 00 00 00 00 00 00 00 00 00 00 00 00 00 00 00 00 00 00 00 00 00 00 00 00 00 00 00 00 00 00 00 00 03 00 00 00 00 00 00 00 00 00 00 00 00 00 00 00 00 00 00 00 00 00 00 00 00 00 00 00 00 00 00 00 00 00 00 00 00 00 00 00 00 00 00 00 00 00 00 00 00 00 00 00 00 00 00 00 00 00 00 00 00 00 00 00 00 00 00 00 00 00 00 00 00 00 00 00 00 00 00 00 00 00 00 00 00 00 00 00 00 00 00 00 00 00 00 00 00 00 00 00 00 00 00 00 00 00 00 00 00 00 00 00 00 00 00 00 00 00 00 00 00 00 00 00 00 00 00 00 00 00 00 00 00 00 00 00 00 00 00 00 00 00 00 00 00 00 00 00 00 00 00 00 00 00 00 00 00 00 00 00 00 00 00 00 00 00 00 00 00 00 00 00 00 00 00 00 00 00 00 00 00 00 00 00 00 00 00 00 00 00 00 00 00 00 00 00 00 00 00 00 00 00 00 00 00 00 00 00 00 00 00 00 00 00 00 00 00 00 00 00 00 00 00 00 00 00 00 00 00 00 00 00 00 00 00 00 00 00 00 00 00 00 00 00 00 00 00 00 00 00 00 00 00 00 00 00 00 00 00 00 00 00 00 00 00 00 00 00 00 00 00 00 00 00 00 00 00 00 00 00 00 00 00 00 00 00 00 00 00 00 00 00 00 00 00 00 00 00 00 00 00 00 00 00 00 00 00 00 00 00 00 00 00 00 00 00 00 00 00 00
这四个段是main模块加载进入内存后的各段
Program Headers:
  Type           Offset             VirtAddr           PhysAddr
                 FileSiz            MemSiz              Flags  Align
  LOAD           0x0000000000002000 0x0000000000400000 0x0000000000000000
                 0x0000000000001000 0x0000000000001000  R      0x1000
  LOAD           0x0000000000003000 0x0000000000401000 0x0000000000000000
                 0x0000000000000000 0x0000000000001000  R E    0x1000
  LOAD           0x0000000000003000 0x0000000000402000 0x0000000000000000
                 0x0000000000000000 0x0000000000001000  R      0x1000
  LOAD           0x0000000000003000 0x0000000000403000 0x0000000000000000
                 0x0000000000001000 0x0000000000001000  R      0x1000
  LOAD           0x0000000000004000 0x0000000000404000 0x0000000000000000
                 0x0000000000001000 0x0000000000001000  RW     0x1000
其中R E标志的是代码段,可以看到, 代码段的FileSiz 为0, 但是MemSiz 不为0
这是因为, coredump不会保存代码段, 使用gdb调试时, 使用file命令将main程序加载后, 使用main的代码段.
其他各段data,rodata等的FileSiz均不为零, 也就是说保留了崩溃时的数据
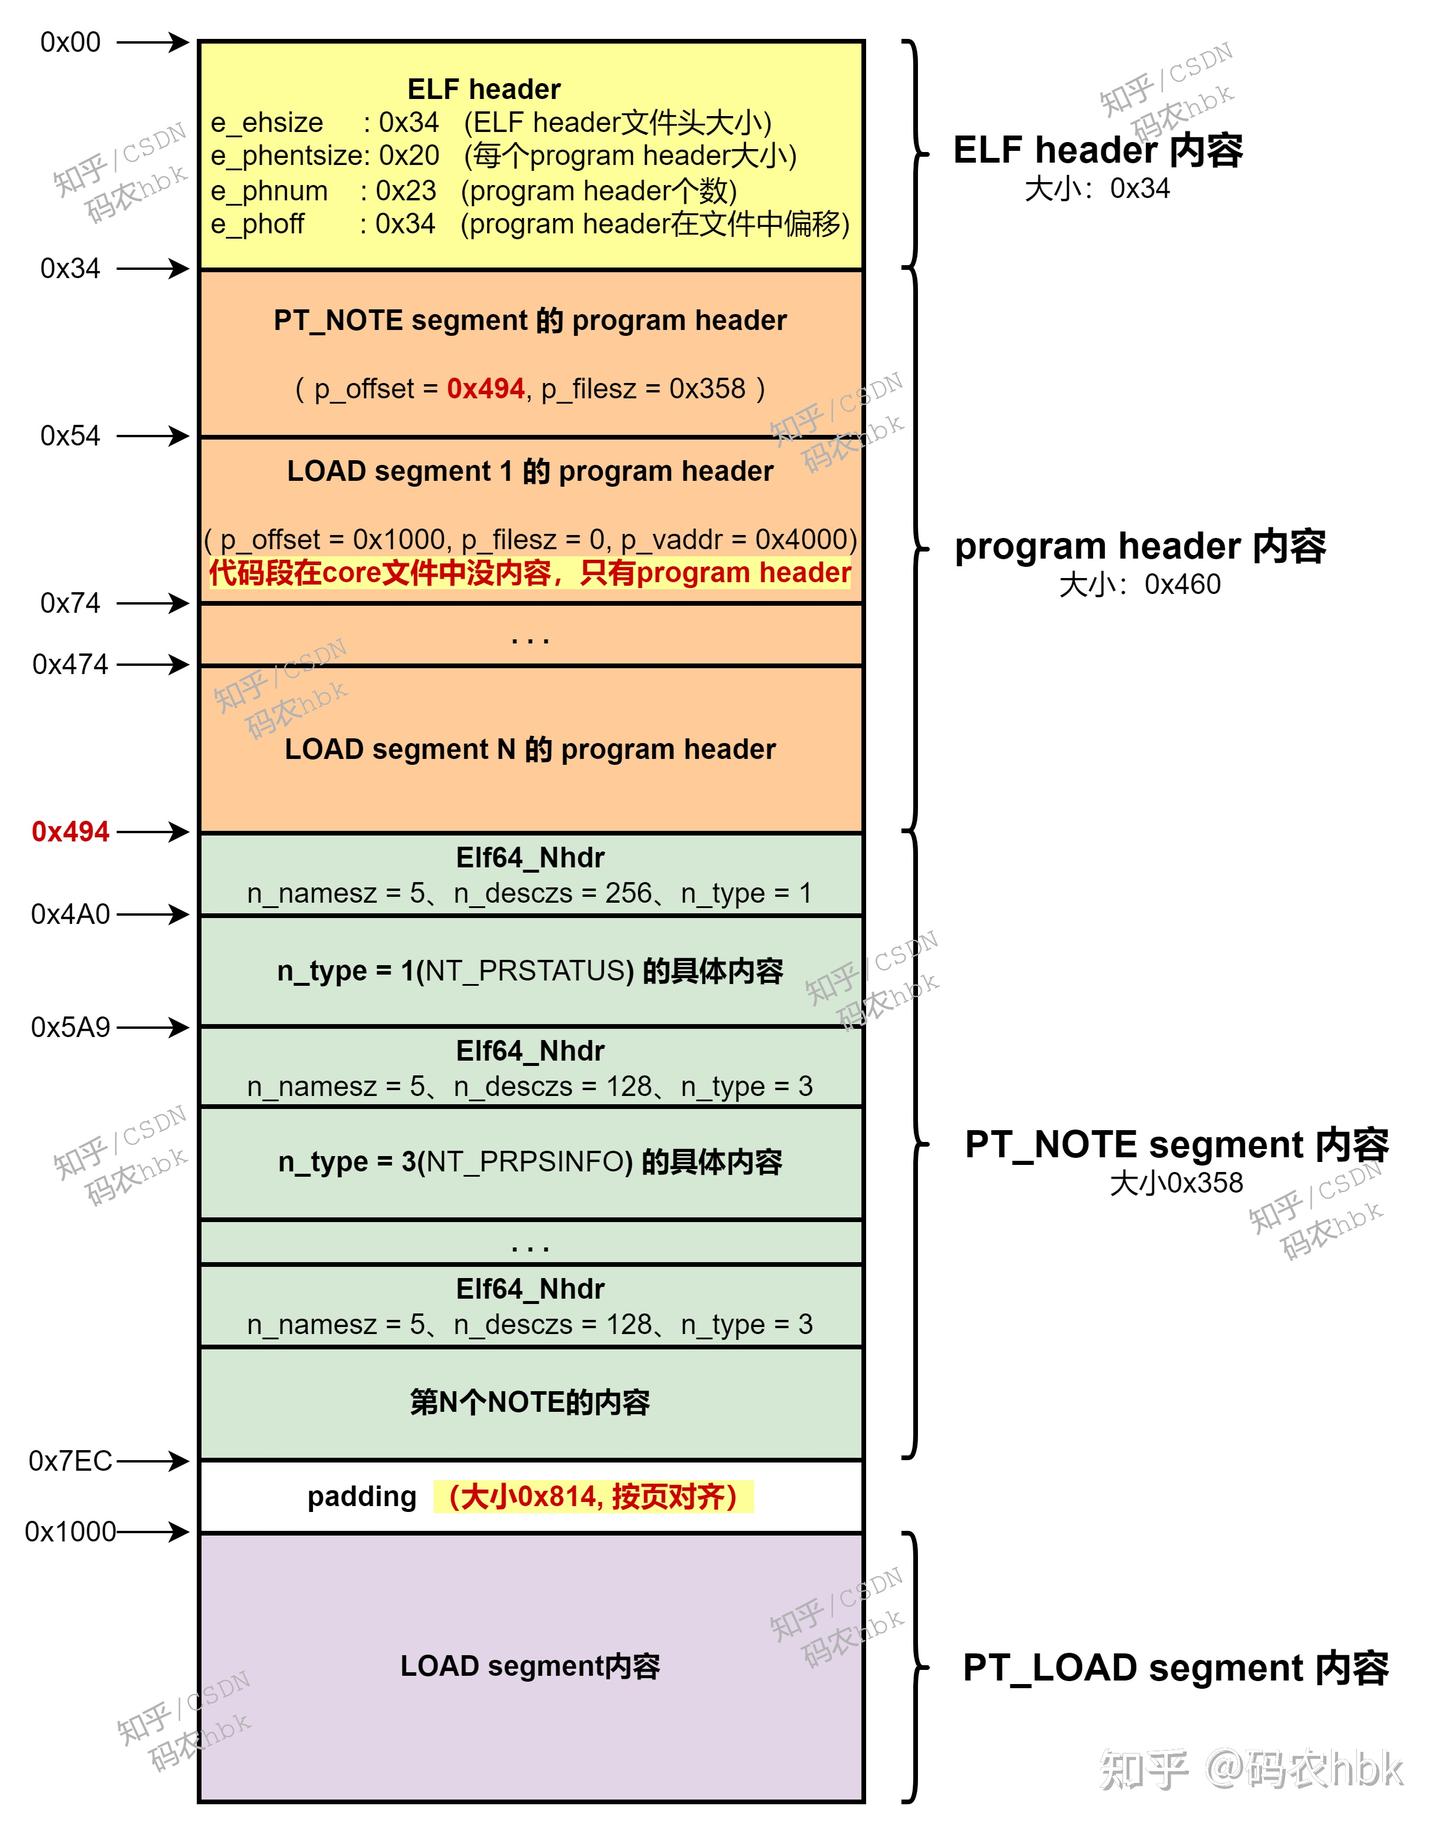
程序段表中第一个条目是一个NOTE, 其他都是LOAD
LOAD就是程序运行时存在的内存段
NOTE存储了如下几个结构体,
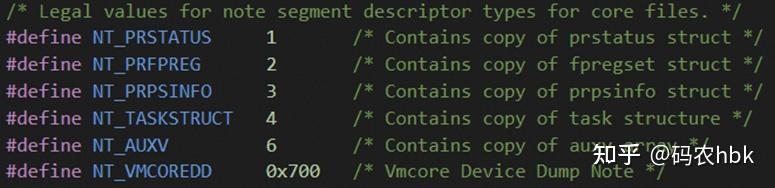
包含了崩溃上下文等重要信息
调试coredump文件
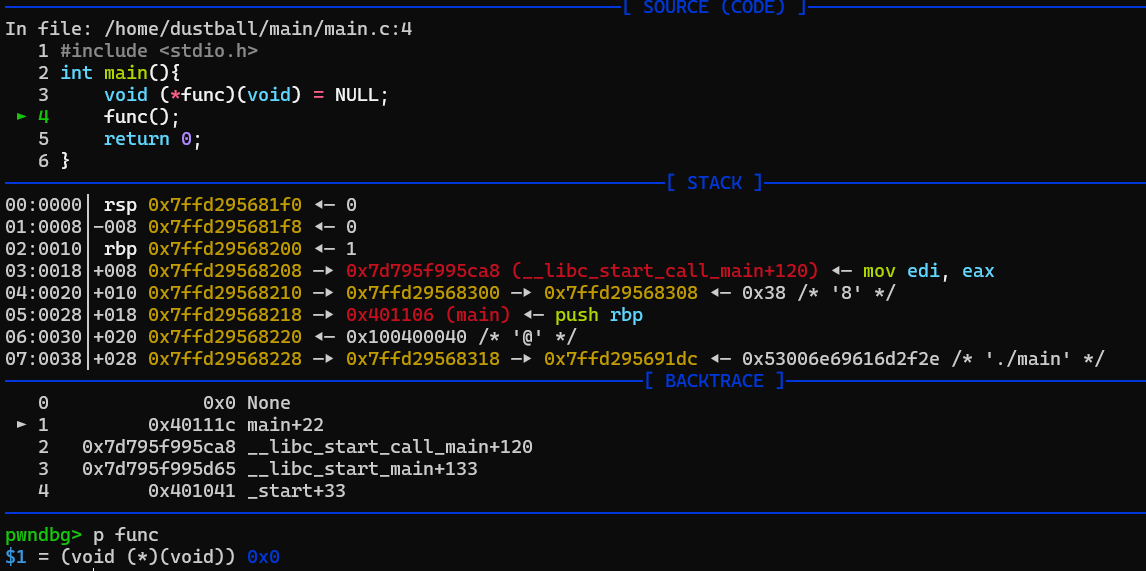
此时可以看到当前函数反汇编为Invalid address 0x0, 程序计数器RIP = 0, 也就是调用了空的函数指针
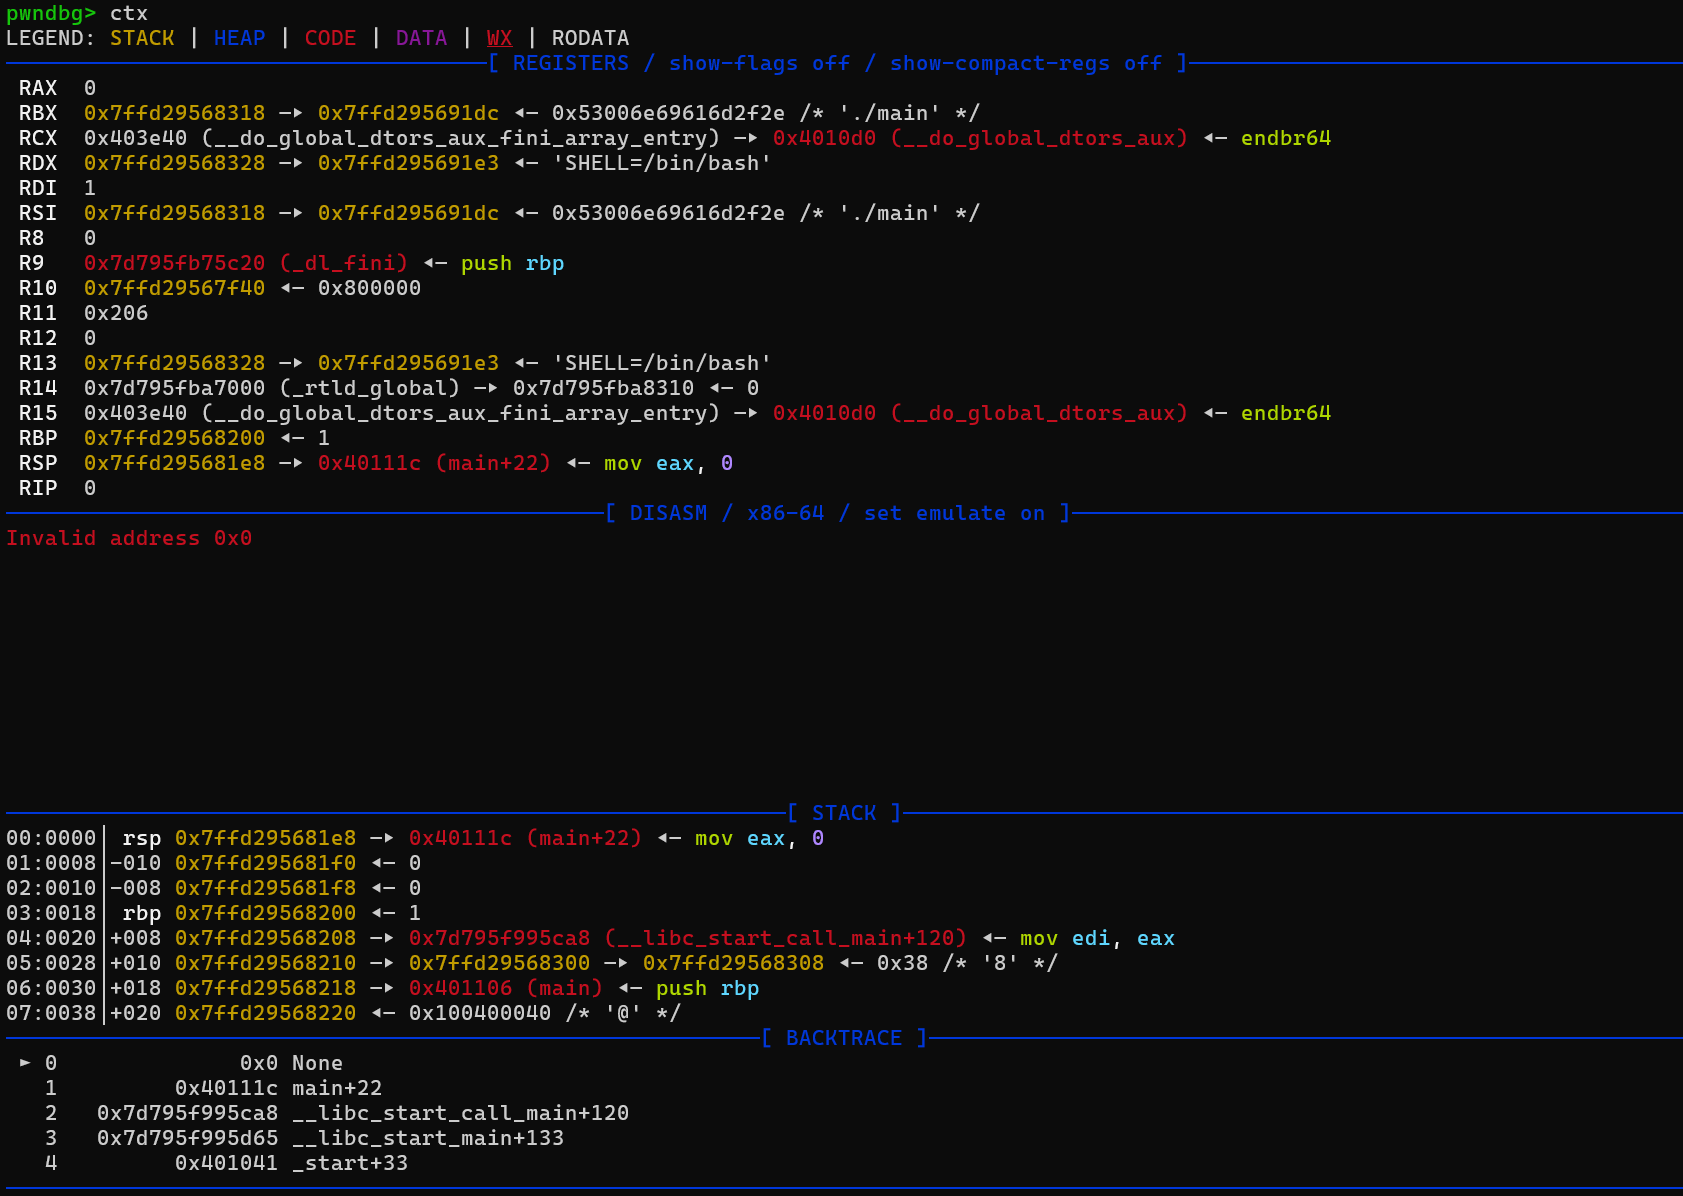
可以使用bt以及frame命令退回到调用者main中查看func函数指针的值, 是0